
Understanding Options: A Real-World Example
The research views expressed herein are those of the author and do not necessarily represent the views of CME Group or its affiliates. All examples in this presentation are hypothetical interpretations of situations and are used for explanation purposes only. This report and the information herein should not be considered investment advice or the results of actual market experience.
By Craig Bewick, Senior Director, Retail Sales
One of the first concepts new options traders should be aware of is implied volatility (IV). If you search for the definition of implied volatility, the most common search engine result is «implied volatility represents the expected volatility (or price movement) of the underlying instrument over the life of an option».
Because IV represents the market consensus of what the price volatility of the underlying instrument will be it is indeed a very important concept to understand. Ceteris paribus, the higher the IV of an option, the more expensive or the higher the premium a seller will charge for that option and vice versa.
Standard Pricing Model
While IV is often described as an input to a standard pricing model, we prefer to think of it as an element that «falls out» or is derived from a pricing model. Of course, if one was performing a theoretical or academic exercise to determine the theoretical value of an option, they would, indeed, typically input an IV level into the model they chose in order to generate a theoretical value. Most options models incorporate the following inputs:
- Strike price of the option: Chosen by the trader (known)
- Days until expiration: Chosen by the trader (known)
- Price of the underlying instrument: Determined by the «market» (known)
- Interest rate: Generally, the accepted «risk free» rate (known)
All the above inputs are known to the trader. The trader can also determine what the current price or value of the option is because it’s generally a result of a bid/offer process, at CME Group it usually occurs on the Globex central match engine or the open outcry trading floor.
The unknown element to pricing an option is how much the underlying instrument will move between the execution of the options trade and the expiration of the option (implied volatility).
Proxy For Volatility
To illustrate, let us assume the current market in a given option is generically 3.5 bid at 4 offer. Next assume everything else stays constant but the market price for our option changes to 3 bid at 3.5 offer. Since the value of the option decreased and nothing else changed, we conclude that implied volatility or the amount of movement in the underlying that the market is implying must have also declined.
Some traders use the straddle (long a call and put at the same strike) as a proxy for the volatility level in a given options market. This makes some intuitive sense if one thinks about putting on a speculative long straddle position.
Since the long call in the position will increase in value as the price of the underlying goes up (again, and importantly, all else equal) and the long put if the price declines, the total premium for the straddle represents the magnitude of the price move required for the position to become profitable.
Options Skew
Another, perhaps lesser-known but important, concept in option pricing is that of options «skew». This refers to the idea that different strikes and calls and puts, even on the same underlying and expiration, can trade at different implied volatility levels. This can be relative to different strikes within calls or puts or the relative value of calls versus puts.
Historically, options skew was introduced to the market after the stock market crash in 1987, when options sellers began demanding higher premiums to protect against such «black swan» type events.
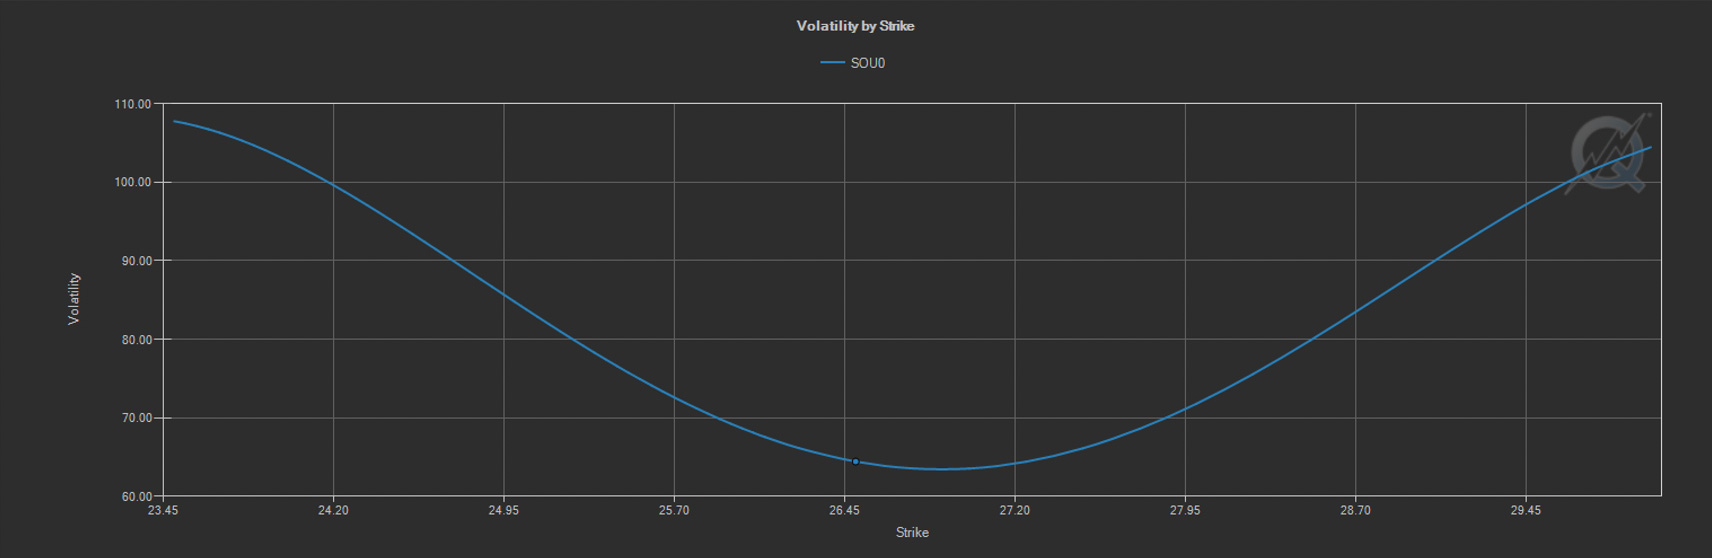
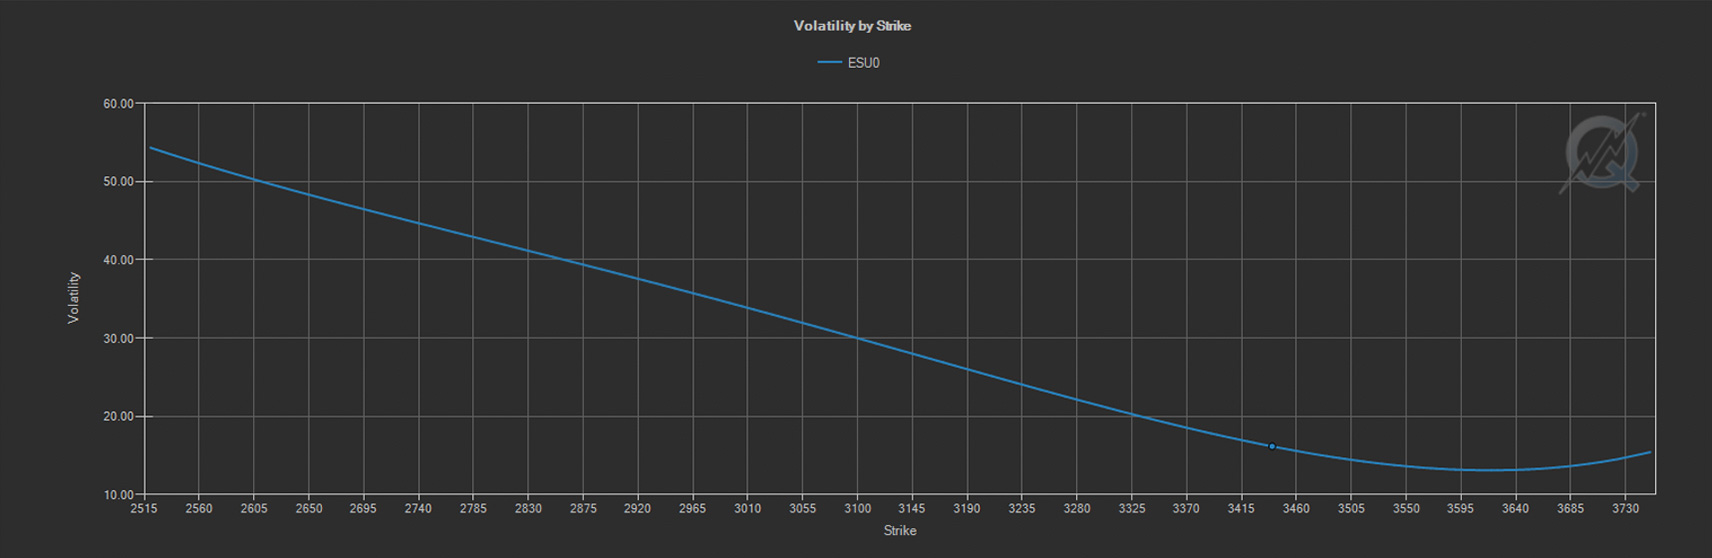
The shape of the skew curve differs among products based on the perceived likelihood of outsized moves in the price of the underlying. As you can see in these two QuikStrike® images, the skew in Silver options is much more a «smile» than the «smirk» in Equity options.
Risk Reversal
Another proxy for measuring skew is risk reversal, a measure of the volatility in calls versus puts in a specific expiration. Before going deeper into the risk reversal, it’s important to understand a couple of basic options principles related to the relationship between calls and puts.
Calls and puts maintain a price relationship with one another within a given option expiry. In fact, one of the first options lessons some new professional traders learn is that «calls and puts are the same; they just have a different positive or negative sign».
Simple Example
Perhaps the most effective way to explain the relationship is with a simple example of «put-call parity». Put-call parity refers to the fact that the following formula must hold true, lest there would be arbitrage opportunities introduced into the market:
Call price – put price + strike price = Futures price
To prove our point, we took at snapshot from CME Group’s CME Direct trading front end (8/25, 8:10 AM Chicago Time) of the current market in the E-mini S&P 500 August Week 4 options:
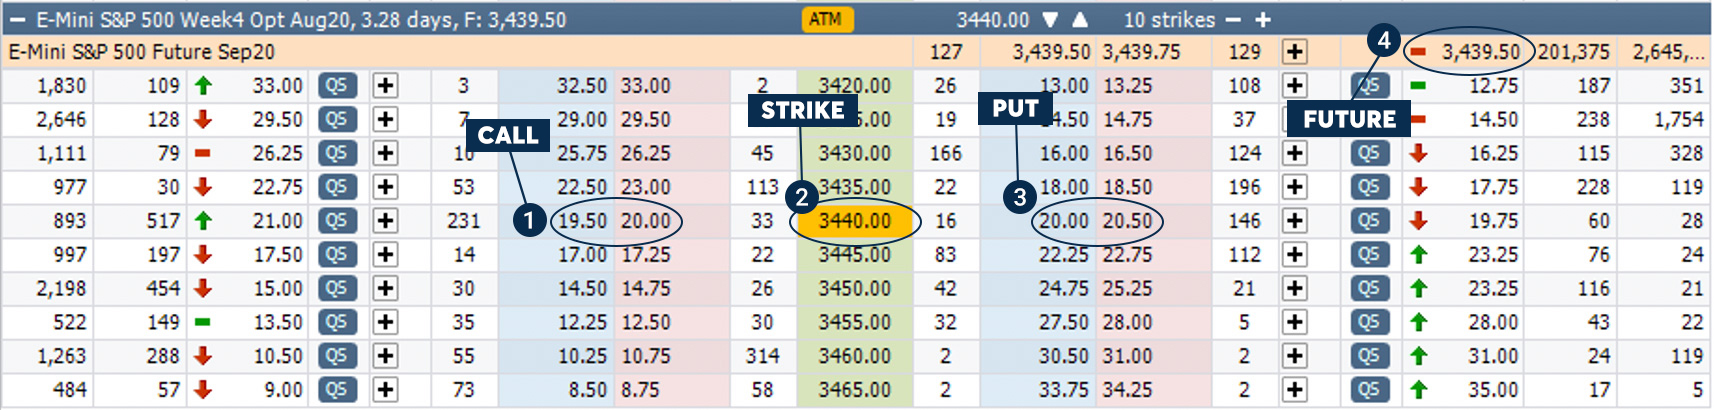
Taking the mid-point of the call and put markets in the 3,440 strike, we find that the current prices:
- Call = 19.75
- Put = 20.25
- Strike = 3,440
- Future = 3,439.50
Which gives us the following equation: 19.75-20.25+3,440=3,439.50
Because of this relationship, if one were to buy a call and sell a put at the same strike, they would create a position with the identical P&L characteristics of a long future (and vice versa). Since this position would possess the same payoff characteristics as a long future, market participants are likely to quickly bring the prices back into line to capture any existing arbitrage if they were to diverge.
Buying a Call And Selling a Put
In fact, in certain situations when CME Group futures experience a «locked limit» price move, the options markets may continue to trade and allow traders to discover a «synthetic» futures price.
A risk reversal is another name for buying a call and selling a put (or vice versa). These trades can be used to assume a speculative position in a market or can be used to hedge an existing position. Keep in mind, we showed an example that used the same strike in the call and put, which resulted in a position with a Delta value of 1.00 (like a future).
Oftentimes, traders will initiate risk reversal positions using out of the money options, which will also result in directional positions but with beginning delta values of less than 1.00.