
The pandemic has been the defining economic event of 2020, overshadowing the usual influences on currency markets like monetary and fiscal policy. Normally, currencies of major commodity exporters track indices weighted to reflect the economic importance of their various raw materials exports.
So far in 2020, some of these currencies, notably the Australian and New Zealand dollars (AUD and NZD, respectively) have continued to track their commodity indices closely. Other currencies, such as the Brazilian real (BRL), Chilean peso (CHL) and South African rand (ZAR) have sharply underperformed their respective commodity indices. Currencies like the Canadian dollar (CAD), Russian ruble (RUB) and Colombian peso (COP) fall into an intermediate category.
The key determinant in whether a currency has kept pace with its commodity index appears to be the rate of COVID-19 infections. The pandemic struck countries at different times and with highly varied mortality rates. The greater the number of deaths per capita, the more likely the currency has underperformed its respective commodity index on a risk-adjusted basis.
Risk-Adjusted Basis
Since currency markets tend to be less volatile than commodity markets, in order to compare their relative direction we calculate the information ratio of both the currency versus the U.S. Dollar (USD) and the commodity index (also priced in USD) between February 1 and November 8, 2020. We then subtract the commodity information ratio from the currency information ratio. If the number is positive, the currency outperformed the commodity index on a risk-adjusted basis.
If the number is negative, then the commodity index outperformed the currency on a risk-adjusted basis. The information ratio is the annualized excess return divided by the annualized standard deviation of excess returns, or put more simply, return divided by risk.
Greater Impact
Comparing the risk-adjusted performance of the currency minus that of the locally weighted commodity index with the rates of COVID-19 mortality, reveals a negative correlation of -0.63, albeit among a small sample group of only eight nations. In other words, the greater the impact from COVID-19, the more likely that a currency was to underperform its local commodity index when controlling for the level of currency and commodity volatility.
Australia and New Zealand
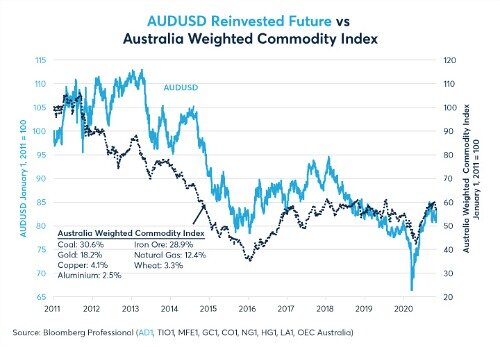
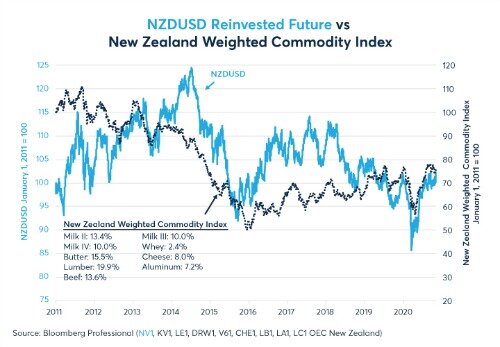
Australia and New Zealand have very different commodity exports. Australia’s commodity exports focus on coal (31 percent), iron ore (29 percent), gold (18 percent), copper and aluminum (7 percent). By contrast, New Zealand’s exports are heavily weighted on dairy (60 percent), beef (14 percent), lumber (20 percent) and aluminum (7 percent).
Despite these differences, both the Australia-weighted and New Zealand-weighted commodity indices fell in Q1 and rebounded in Q2 (Figures 1 and 2). On a risk-adjusted basis, Australian Dollar and New Zealand Dollar largely kept pace with their respective commodity indices. Despite extremely low rates of COVID-19 mortality relative to their peers, neither currency outperformed its commodity index by much on a risk-adjusted basis.
While their commodity sectors have seen only modest impacts from COVID-19, other sectors such as tourism have been hard hit. Tourism accounts for 3 percent of Australia’s GDP and 6.5 percent of GDP in New Zealand.
Canada and Russia
Both Canada and Russia are major exporters of energy, metals and agricultural products. Both have been harder hit by COVID-19 than Australia and New Zealand but not as badly hit as some of their other peers. Canadian Dollar and Russian Rubel have somewhat underperformed their commodity indexes so far during the pandemic.
Unlike, Australia and New Zealand, which are heading into their summers with close to zero ongoing mortality from COVID-19, Canada and Russia have seen a sharp uptick in recent COVID-19 related mortality. This poses two difficult questions for the Canadian Dollar and Russian Rubel going forward.