
The speed of the decline in employment due to the pandemic-induced shutdown in the U.S. has been unprecedented. The policy responses have been immediate and massive from the Federal Government and the Federal Reserve. To examine these issues, we have organized this report on the U.S. economy into five sections.
By Blu Putnam, Chief Economist & Erik Norland, Senior Economist
First, we want to simply review the damage to the economy in terms of the impact on employment. Second, we will discuss the fiscal and monetary policy responses.
Then, we will discuss some of the implications for labor productivity and the pace of recovery; interaction of massive debt and interest rates; and finally, some scenarios for short and long-term inflation based on the fusion of fiscal and monetary policy, known as Modern Monetary Theory or MMT.
Employment Situation
The unemployment data tells the story of the economic damage in the U.S. better than any other data, and the numbers are overwhelming. The weekly release of new applications for state unemployment insurance is now widely watched, as they represent the most current information available. From March 15 through May 16, 2020, in just nine weeks, over 40,767,000 people filed claims for unemployment insurance.
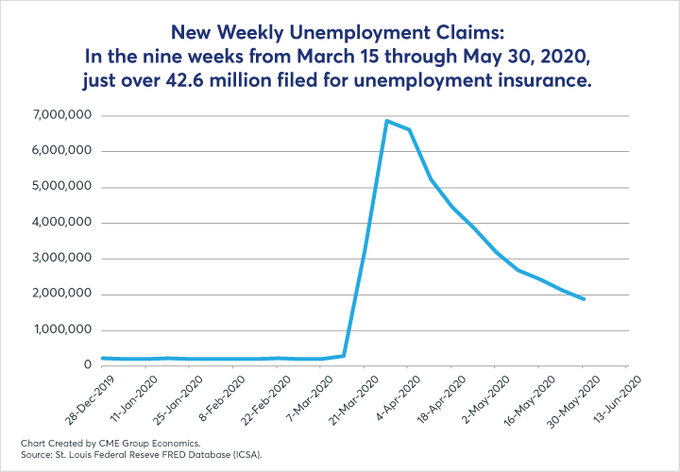
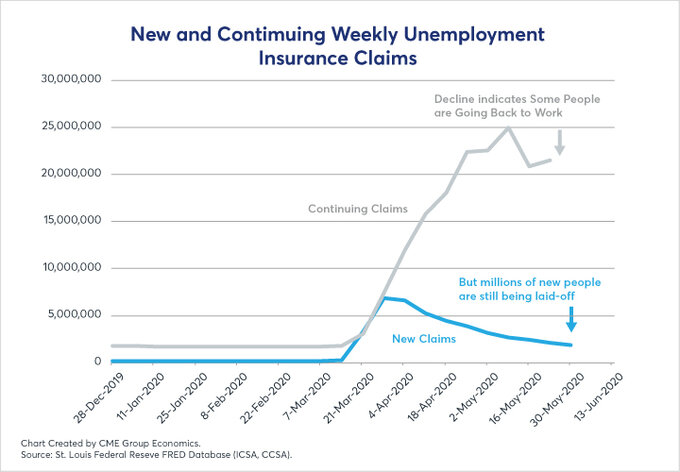
To put this number in perspective, the U.S. civilian labor force was estimated to be 156,481,000 in April, the latest monthly jobs report at that time. Thus, 26.05 percent of the labor force were laid off in nine weeks. Since then, we know that some people have been able to go back to work. We follow the weekly continuing unemployment claims for this information.
Continuing claims actually fell from 24,912,000 for the week ending May 9, 2020, to 21,052,000 the next week. This was a good sign that the economy was re-opening with 3,860,000 leaving the unemployment insurance programs, even though over 2,000,000 new claims were being filed the same week.
Fiscal and Monetary Policy Responses
Fiscal and monetary policy responses have been massive and immediate. It is interesting to put the policy responses in context by comparing them to the Great Recession of 2008-2009 and the Great Depression of the 1930s.
Back in 1929-1933, the Federal Reserve (Fed) stood by and watched banks fail by the thousands. This was especially unfortunate since the Fed had been created after the financial panic of 1907 specifically to serve as the lender of last resort for the financial system to prevent future panics from turning into depressions. The Fed failed its first test spectacularly in the 1930s.
A key feature distinguishing 2008 from 1929 in the U.S. was the response of the Fed. Once the extent of the financial panic was clear in September 2008 after the poorly managed bankruptcy of Lehman Brothers and the messy bailout of the insurance giant AIG, the Fed understood that decisive action was needed as the «lender of last resort» to preserve the stability of the U.S. financial system.
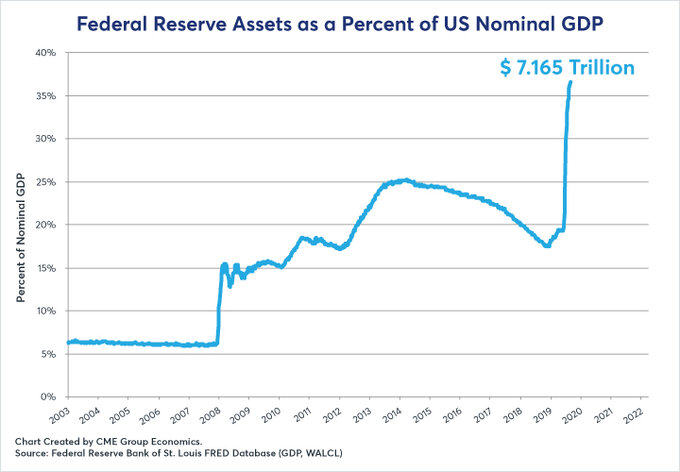
Within just a few months, the Fed had purchased about $1 trillion of distressed securities, lifting that burden from the books of the banking system, as well as reducing short-term rates to near zero and providing special support to several sectors of the financial system with emergency lending programs.
This time around in 2020, the Fed has pulled out the playbook from 2008 and added several more trillions of financial system support for good measure. The lesson from the 1930s was not to stand-by and watch helplessly. The lesson from 2008 was to act quickly, decisively, and with maximum force.
Balanced Budgets
Fiscal policy responses were very different between 1929 and 2020 as well. The depression was well underway before the Presidential election of November 1932. Both candidates affirmed a commitment to fiscal discipline in the face of the crisis. Franklin D. Roosevelt (FDR) won the election handily, and he was not long in office before he realized that massive stimulus and public works programs were needed to reduce unemployment.
FDR quickly forgot about any desire for balanced budgets. With the Fed on the sidelines in the 1930s, the fiscal stimulus was critical in rebuilding the economy. We do note though that in 1936-37, there was a return to fiscal austerity which led to a setback in 1937 for the economy, and it was largely the war spending in the 1940s that conclusively ended the Great Depression.
Tax Cuts Allowed
At the end of 2008, as the financial panic was in plain view, the U.S. Congress enacted a trillion-dollar spending program, which helped get the economy back on its feet in 2009. After 2009 though, there was a sort of mini-austerity that took place largely as a result of political gridlock.
Spending sequestration went into effect in 2011, and the 2001 and 2003 tax cuts were allowed to expire at the end of 2012 along with a 2009 payroll tax cut. Slower spending growth and higher taxes helped to shrink the U.S. budget deficit from 10 percent of GDP in 2009 to just 2.2 percent of GDP in 2016.
Spending Restraint Lifted
In doing so, it placed more of the burden of supporting growth on the Fed, which kept rates below 1 percent until the middle of 2017. In addition to the restraints on Federal spending, state and local governments also slashed spending in the wake of the 2008 financial crisis, and they did not begin to contribute to employment gains until 2013.
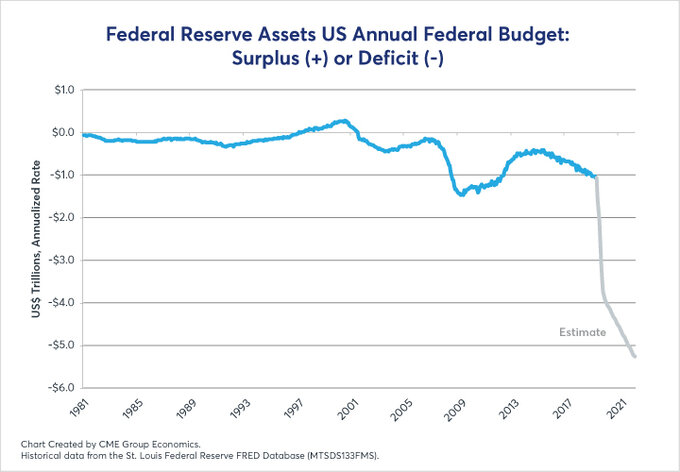
The spending restraint was lifted by Congress in 2017, and tax cuts were enacted in December 2017. The combination of higher spending and tax cuts grew the Federal deficit from 2.2 percent of GDP in 2017 to 5 percent of GDP on the eve of the pandemic. In 2020, a divided and highly partisan gridlock in the U.S. Congress was broken by the need to act decisively.
Signed Into The Law
Well over $2 trillion of spending has been approved and signed into law. The budget deficits are broadly expected to soar to $4 trillion a year by the end of 2021, bringing them to around 20 percent of GDP and perhaps higher if Congress appropriates additional funds.
- Read the whole article here
The research views expressed herein are those of the author and do not necessarily represent the views of CME Group or its affiliates. All examples in this presentation are hypothetical interpretations of situations and are used for explanation purposes only. This report and the information herein should not be considered investment advice or the results of actual market experience.