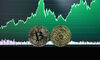
Despite battling through global economic events, including U.S.-China trade tensions, a volatile and depreciating Chinese yuan, and falling commodity prices, asset returns in 2019 were bountiful for investors, particularly in contrast to 2018.
The S&P 500 closed the year with total returns of +31.5 percent, whilst emerging markets (EM) returned 18.9 percent1.
Such distinctive growth trends have been prevalent since the 2010s, with the S&P 500 having more than tripled the compounded annual growth rate at 249 percent and MSCI Emerging Markets Index having only returned 49 percent in dollar terms during the same time period2.
However, it should be noted that the encouraging performance of the S&P 500 in the last decade has largely been driven by the exponential growth of tech companies such as Facebook, Amazon, Apple, Netflix and Alphabet (formally known as Google), with technology and e-commerce stocks representing 28 percent of all U.S. profits – resulting in the index’s relative lack of breadth3.
The Development of EM
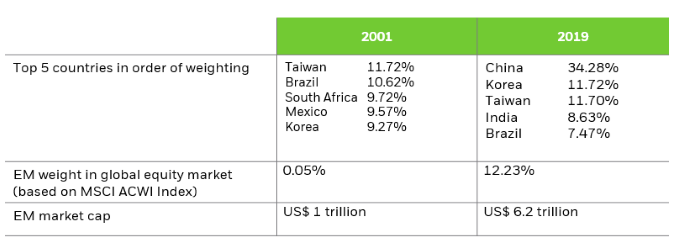
Since the launch of the MSCI Emerging Markets Index in December 1987, its growth and transformation has been dramatic. Over the past three decades, it has shifted from an index covering just 10 countries and comprising less than 1 percent of the global equity market, to a ubiquitous benchmark that is tracked by close to $2 trillion of assets, representing 24 countries, across 5 regions, with over 1,100 constituents and at a market cap of a staggering $6.2 trillion4 (refer to Exhibit 1)
Exhibit 1: At a Glance – MSCI EM Index; Past and Present
Transitioning From «Tactical Tourism» to a More Prolonged Presence
The extraordinary growth of emerging markets has offered global investors return enhancement opportunities and risk diversification, but idiosyncratic country risk and underperformance vs. US equities in the past decade have driven a phenomenon of ‘tactical tourism’ for regional allocations to EM, rather than a core holding.
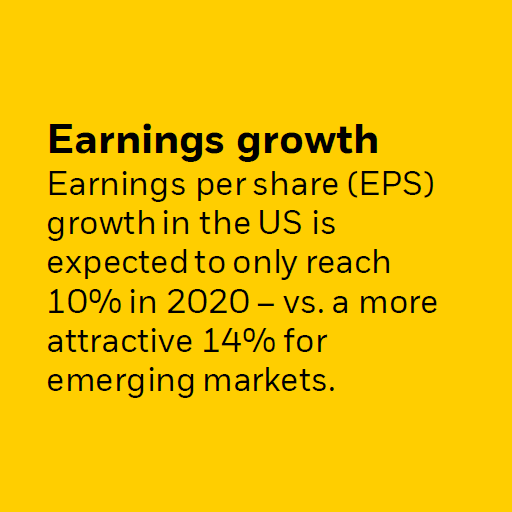
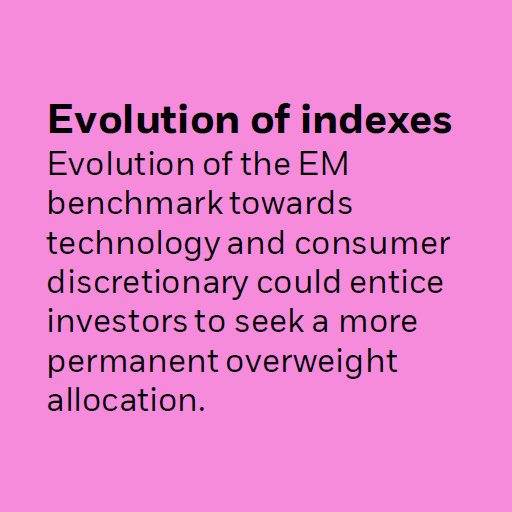
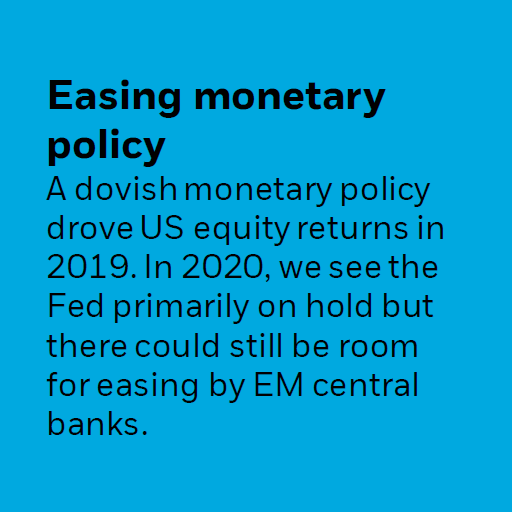
However, the three Es of EM investing: 1) earnings growth, 2) evolution of indexes, and 3) easing monetary policy, have started to shift this long-held investment attitude (refer to Exhibit 2).
Exhibit 2: The Three Es of EM Investing in 2020 and Beyond6
An Emerging Bull in a China/EM Shop?
Despite a respectable total return of 19 percent in 2019, following an astounding 40 percent in 2017, tactical tourism has meant that MSCI EM has been stuck in a technical secular bear market since 2007. If our base-case comes to fruition in the form of relative stability combined with EM EPS growth outperforming US EPS growth, a new structural bull market phase could be in the running for emerging markets – technically speaking.
Accessing Emerging Markets With ETFs
Exchange-Traded Funds (ETF) could be a convenient way for investors to gain exposure to emerging markets. The simple building-block nature of an ETF allows investors to effectively diversify their existing portfolios by adding a specific market and/or industry exposures. Other benefits of ETFs include:
- Transparency: ETFs are relatively straightforward and transparent in their investment objective, as well as mostly transparent in their holdings
- Accessibility: ETFs offer access to market exposure of a variety of asset classes, both broad and specific
- Liquidity: ETFs tend to be highly liquid, and can be bought and sold on a stock exchange during market hours
- Cost efficiency: ETFs generally have a lower management fee compared with an active fund invested in the same market and/or assets
About iShares by BlackRock
iShares unlocks opportunity across markets to meet the evolving needs of investors. With more than twenty years of experience, a global line-up of 900+ exchange-traded funds (ETFs) and US$2.24 trillion in assets under management as of December 31, 2019, iShares continues to drive progress for the financial industry. iShares funds are powered by the expert portfolio and risk management of BlackRock, trusted to manage more money than any other investment firm7
Want more?
If you any questions or would like to find out more about this topic, please speak with your BlackRock relationship manager.
1 Index performance is for illustrative purpose only. Investors cannot invest directly into an index.
2 Index performance is for illustrative purpose only. Investors cannot invest directly into an index.
3 Source: ‘Emerging Markets in 20:20’, BlackRock (Taw, Thomas and Liu, Gladys); published February 2020.
4 MSCI; data as of 31 December 2019.
5 MSCI; data as of 31 December 2019.
6 Source: ‘Emerging Markets in 20:20’, BlackRock (Taw, Thomas and Liu, Gladys); published February 2020. For illustrative purpose only. There is no guarantee that any forecast made will come into pass.
7 Based on US$ 7.43 trillion in AUM as of 31 December 2019.
Source: All content and data in this article is based on ‘Emerging Markets in 20:20’, BlackRock (Taw, Thomas and Liu, Gladys); published February 2020.
Important Disclaimers: This article is issued by BlackRock (Singapore) Limited (company registration number: 200010143N). This advertisement or publication has not been reviewed by the Monetary Authority of Singapore. In Hong Kong, this material is issued by BlackRock Asset Management North Asia Limited and has not been reviewed by the Securities and Futures Commission of Hong Kong. Investment involves risk. Past performance is not necessarily a guide to future performance. The value of investments and the income from them can fluctuate and is not guaranteed. You may not get back the amount originally invested. Changes in the rates of exchange between currencies may cause the value of investments to fluctuate. Any research in this document has been procured and may have been acted on by BlackRock for its own purpose. The results of such research are being made available only incidentally. The views expressed do not constitute investment or any other advice and are subject to change. They do not necessarily reflect the views of any company in the BlackRock Group or any part thereof and no assurances are made as to their accuracy. iShares® and BlackRock® are registered trademarks of BlackRock, Inc., or its subsidiaries in the United States and elsewhere. © 2020 BlackRock, Inc. All rights reserved. All other trademarks, servicemarks or registered trademarks are the property of their respective owners.
MKTGH0220A-1096946