
China’s Growth Recovers Amid Signs of Caution
Prior to the pandemic, China’s official data showed many years of stable growth ranging from 6.2 percent to 7.5 percent year on year, rarely missing the consensus estimate by more than 0.1 percent. That is no longer the case.
By Erik Norland
Although the number was 0.6 percent below consensus, it was an improvement on the 3.2 percent growth in Q2 and -6.8 percent in Q1. So far this year, overall growth in the world’s second largest economy is just 0.7 percent versus the same three quarters in 2019, about one-tenth its usual pace of expansion.
Looking past the headline number reveals several important but easily overlooked trends, some of which are encouraging and others not:
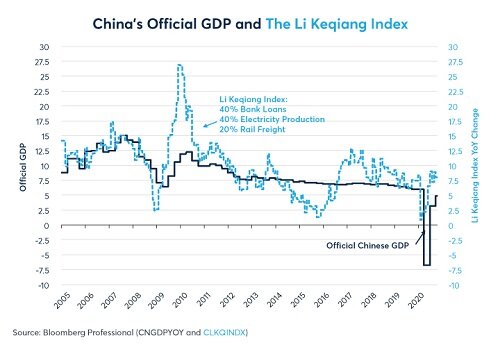
- China’s industrial sector is booming, expanding at around 8-9 percent per year (Figure 1).
- By contrast, overall growth at only 4.9 percent YoY in Q3 implies that China’s service sector remains stagnant.
- Debt levels are soaring. So far in 2020, household debt as a percentage of GDP has risen from 55.8 percent to 61.4 percent; non-financial corporate debt has increased from 150.3 percent to 163.4 percent, and public sector debt has risen from 38.1 percent to 44.4 percent. China’s overall level of leverage has risen from 244.3 percent to 269.2 percent according to China’s National Bureau of Statistics and the People’s Bank of China.
- China’s imports are strong, but exports are weakening.
Figure 1: Industrial growth has been 8-9 percent YoY but overall GDP just +4.9 percent YoY in Q3
-
Overall, the GDP numbers, taken in the context of the other data such as the industrially focused Li Keqiang index, indicate that China, like much of the world, is experiencing a K-shaped recovery - where one branch ascends while the other descends. In China, as elsewhere in the world, the ascending branch includes those who can telecommute to work. Additionally, China’s industrial sector, perhaps more than anywhere else, is moving upward at about the same pace as before.
-
The descending part of the K includes just about everything else: exports, employees who must show up to work in person, notably in the service sector, and the country’s large population of domestic migrant workers. Overall, Q3 GDP paints a picture of a service economy that is not fully back to normal.
-
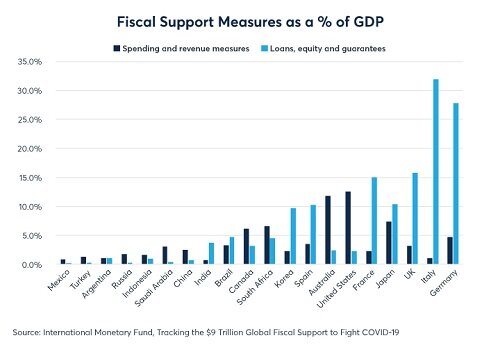
The debt portion of the picture is also troubling. In 2009, when debt levels were much lower (140 percent of GDP), China engineered an economic boom by encouraging businesses to invest in capital projects, taking on large amounts of debt in the process. This time around, the reason for the rise in debt is less clear. The People’s Bank of China (PBoC) has eased lending standards slightly but has done little in the way of lowering interest rates (Figure 2). Moreover, China’s fiscal stimulus is much less robust than elsewhere in the world (Figure 3). One reason why debt could be increasing as a ratio of GDP is because the denominator has stopped expanding rather than the numerator expanding unusually fast. This is to say that, unlike in 2009 during which debt levels soared to ignite growth, debt is now growing at a rather ordinary pace but ratios are expanding because GDP growth has stalled.
Figure 2: The PBoC has not eased lending standards or cut rates much since the pandemic began
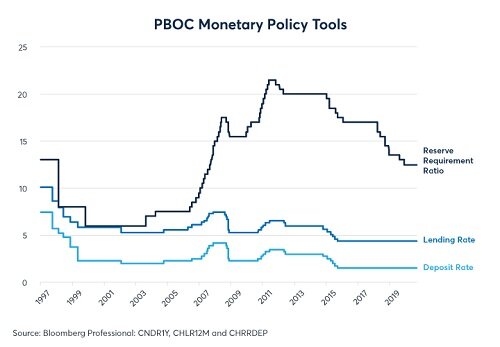
Figure 3: China’s fiscal support measures have been modest compared to Europe, Japan and the US
Overall, this paints a worrisome picture of the Chinese economy. With the pandemic’s resurgence in Europe and North America, there is every reason to think that export demand will remain soft for at least another six months, if not longer. Moreover, China’s domestic growth is uneven and has been fueled by rising levels of debt. Yet, global markets don’t seem overly concerned. Perhaps this is because commodity prices have shown a strong correlation with China’s industrial sector. The Li Keqiang index, which measures rail freight volume, electricity consumption and bank loans, has demonstrated a high correlation with prices of many commodities and currencies over the past 15 years.