
CME: Gold Outshines Silver as Price Ratio Widens
By the end of April 2020, an ounce of gold was equivalent to 111.5 ounces of silver in price, up from 85 ounces when the year began.
By Erik Norland, Executive Director and Senior Economist, CME Group
Gold’s 31 percent gain over silver during the first four months of this year is in line with a trend that began nine years ago in April 2011 when an ounce of gold bought just 31.7 ounces of silver (Figure 1). So, what’s behind the divergence in prices?
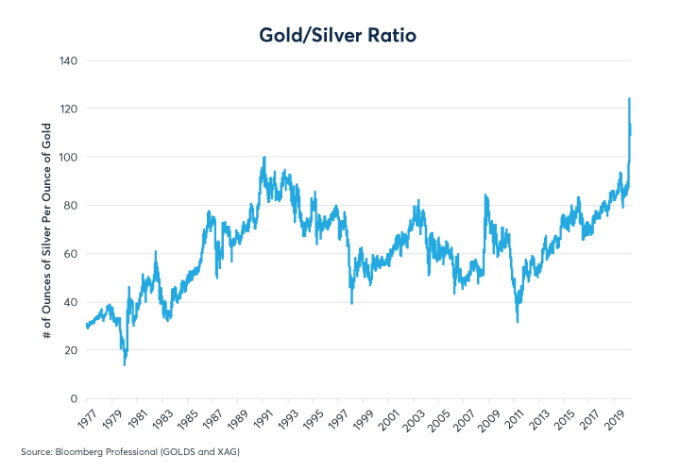
(Figure 1: The gold-silver ratio has gone to unprecedented levels)
The answer to this question lies in the starkly different economic underpinnings of the two metals. The differences rarely show up in their day-to-day movements, but the rolling one-year correlation between the two has remained remarkably high during the past few years (Figure 2) even as their price levels, which moved in tandem from 2000 to 2011, have diverged (Figure 3).
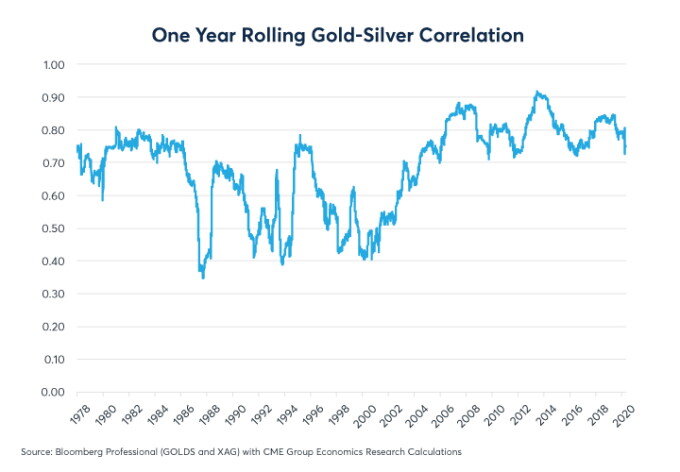
(Figure 2: Even as the gold-silver ratio has risen, day-to-day correlation remain high)
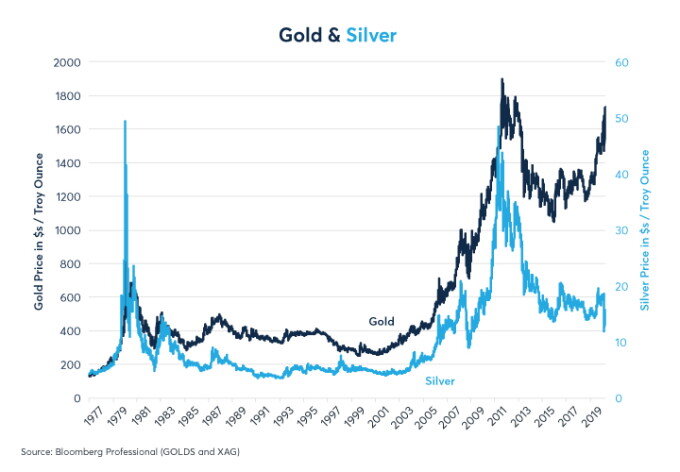
(Figure 3: Gold and silver price levels moved in tandem before diverging in 2011)
In fact, correlations on a day-to-day basis between the two metals have been much higher in recent years than they were between the mid-1980s and the mid-2000s. Rather, silver’s underperformance has been a slow, steady drip, not rising as much as gold, on average, during rallies, and falling more than gold on down days. Only rarely have the metals decorrelated.
Silver’s underperformance relative to gold can be explained by a number of macro-economic factors:
- Fabrication demand: there are important differences in how the metals are used
- The COVID-19 pandemic has very different implications for the two metals
- Central bank activity: gold is a reserve asset and silver (typically) is not
Mirror, Mirror on the Wall, Which is the Most Precious Metal of All?
Judging from market prices, the answer is palladium, which costs more per ounce than gold. That said, among the four «precious» metals of platinum, palladium, gold and silver, three of them are used heavily for industrial purposes. Platinum and palladium find extensive use in the automotive industry as catalytic converters. Silver is also used heavily in industrial processes.
Gold is mainly used in two ways: jewelry and as a store of value. In 2019, 76 percent of the net new gold supply (mining production + secondary recovery minus central bank buying) went into making jewelry. Ten percent was purchased by private investors as official coins, bullion or medallions. Only 14 percent went to industrial use (Figure 4). Jewelry is arguably a form of investment as well, being simultaneously an item of beauty and a store of wealth.
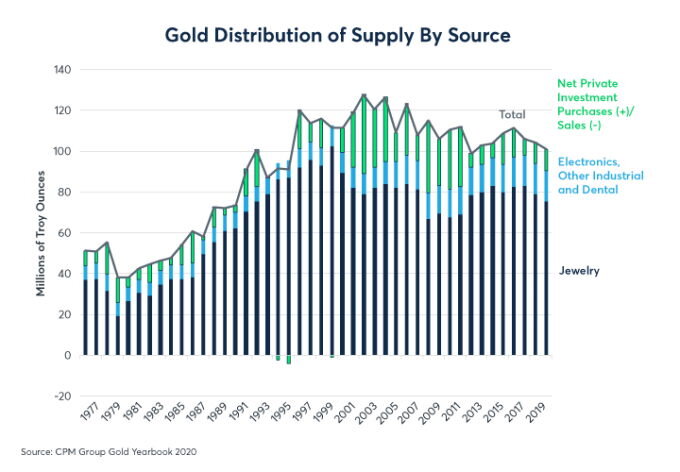
(Figure 4: Gold’s use is overwhelmingly (about 86 percent) for jewelry and investment; 14 percent is industrial)
For silver, investment versus industrial use is flipped the other way. In 2019, only 32 percent of the net new supply of silver was used for jewelry or investment. 68 percent was for electronic, industrial or dental uses (Figure 5). Moreover, net private investment for silver was negative from the late 1980s until about 2016, in stark contrast with gold, where net private investment has remained consistently positive for every year since 1996.
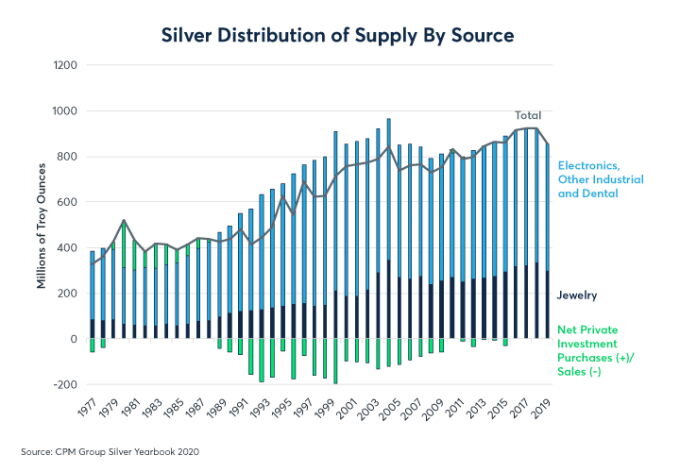
(Figure 5: Silver is classified as precious but it is mostly an expensive industrial metal)
Moreover, a deeper dive into silver’s industrial uses reveals other reasons for its underperformance. Twenty years ago, 266 million ounces, over one-quarter of mining production, were used to develop photographs. With the advent of digital photography, that number has shrunk to 53 million ounces in 2020 and has been falling at a pace of 4-5 percent per year recently.
Nothing else has fully replaced this demand. Silver is used in the making of solar panels but this source of demand peaked just short of 100 million ounces in 2018 and will likely shrink to about 79 million ounces this year. Likewise, its use in electronics and batteries grew until 2018 but has since begun to shrink (Figure 6). The COVID-19 induced global recession could dent industrial demand.
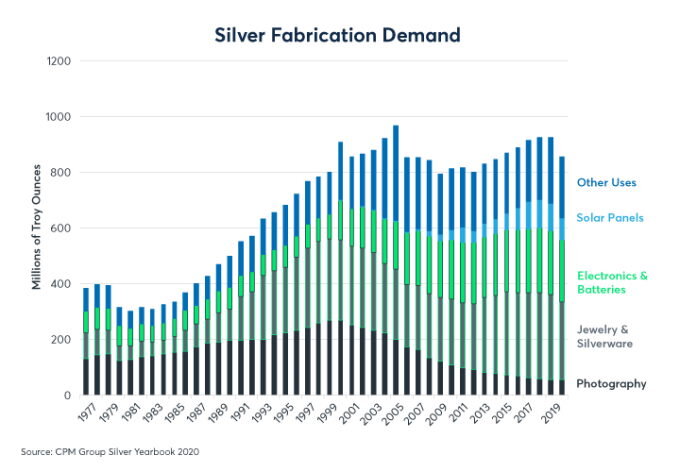
(Figure 6: Photographic demand for silver has fallen 80 percent since 2000)
Perhaps the good news for silver is that traditional photography can only die once. If the 80 percent decline in its use for photographic development since 2000 has been a major drag on the price of silver, at least it’s now mostly in the past. The question for silver is does it find more uses going forward? The answer to that question is unclear.
However, the decline of traditional photography and silver’s use in the industry explains to a large extent the slow, steady nature of its decline versus gold.
Erik Norland is the Executive Director and Senior Economist of CME Group. He is responsible for generating economic analysis on global financial markets by identifying emerging trends, evaluating economic factors and forecasting their impact on CME Group and the company’s business strategy, and upon those who trade in its various markets. He is also one of CME Group’s spokespeople on global economic, financial and geopolitical conditions.