
Phillips Curve: There’s Life in the Old Dog Yet
The low inflation seen in industrialized nations has surprised many economists and calls into question established models. Do instruments such as the Phillips curve still work?
By Andreas Vetsch, Hedge Funds Analyst at LGT
 Curves are omnipresent in macroeconomics. They are graphic representations of generally accepted economic relationships and trends. The Laffer curve, for example, is a cornerstone of supply-side economic theory and illustrates that government revenues can be increased through tax cuts. The Kuznets curve shows the relationship between inequality and economic development, and the Beveridge curve shows the relationship between unemployment and the job vacancy rate. Probably the most important curve is the Phillips curve.
Fight Unemployment With Inflation?
The Phillips curve is based on an article by Alban W. Phillips written in 1958 and illustrates the relationship between the unemployment rate and wage increases. It shows that the higher the unemployment rate, the lower the wage increases in an economy – and vice versa.
According to the model, this is due to the decreasing bargaining power of employees and the dwindling pressure on employers to pay higher wages.
Because companies usually compensate for the cost of a wage increase by raising prices, a modified Phillips curve was later developed that shows the relationship between the unemployment rate and consumer prices. It is based on the premise that unemployment can be counteracted with higher inflation.
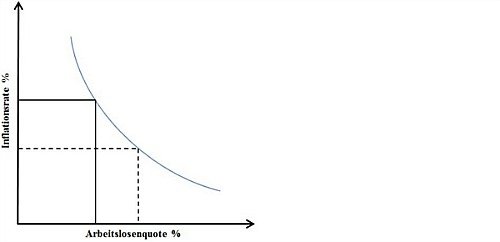
(Inflation rate in %/Unemployment rate in %; Source: LGT Capital Partners)
Missing Inflation Despite Full Employment
For the world’s central banks, the Phillips curve is an important monetary policy instrument. The U.S. Federal Reserve is striving to achieve price stability paired with a high level of sustainable employment. Although the European Central Bank’s mandate is limited to price stability, it also uses the Phillips curve for its monetary policy strategy. Central bankers therefore take the relationship between inflation and unemployment into very careful consideration.
In recent years, however, they have been rubbing their eyes in disbelief: although major economies such as the U.S. and Germany have been growing for years and full employment prevails, inflation is increasing only slowly. This raises the question of whether the Phillips curve is still valid.
The American star economist Nouriel Roubini speaks of the mystery of missing inflation and Princeton professor Alan Binder has gone as far as to talk of the death of the Phillips curve.
The Phillips Curve Put to the Practical Test
Such criticism is not a new phenomenon, however. A look at the past shows a certain instability of the Phillips curve. For example, in the 1970s and early 1980s, the U.S. experienced stagflation, or in other words, high inflation paired with high unemployment.
During that period, Ronald Reagan attempted to fight rising inflation with high interest rates and led the economy into a recession.
According to the Phillips curve, the inflation rates in industrialized nations should also be significantly higher at present. However, numerous reasons are cited as the cause of the surprising lack of inflation – in industrialized countries, unions have lost some of their influence, digitalization allows for a rationalization of jobs and globalization is putting pressure on wage increases.
If one believes these arguments, then wage growth should be expected to remain weak in the coming years, despite low unemployment.
A look at the most recent developments in the U.S., however, paints a different picture. Namely, many investors were surprised by the rise in inflation in the U.S. at the beginning of the year.
The relationship between price stability and employment therefore appears to exist after all, and the missing inflation appears to be a cyclical and not a structural phenomenon. The following graph underscores this:
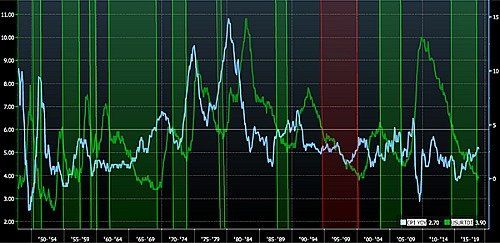
(CPI YOY: U.S. Consumer Price Index; USURTOT Index: U.S. unemployment rate
If one looks at the relationship between U.S. inflation (blue line) and U.S. unemployment (green line) over the years, it can be seen that the Phillips curve theory worked nine times out of ten when unemployment fell below 6 percent.
With the exception of the Asian crisis in 1997 (see red band), there was a strong rise in inflation during these periods (see green bands).
During the current period, prices have also risen since the 6 percent unemployment rate has been reached. It would therefore appear that the Phillips curve continues to be valid.
Not Perfect, But Nonetheless a Useful Model
As indicated at the outset of this article, economic curves are only a visualization of accepted economic relationships – no more and no less. They are abstract models that do not always give consideration to the complex realities. Due to the constant changes in economic relationships, economics cannot always be exact. And divergences between theory and practice will continue to exist in the future.
Perhaps we should reflect on the words of former baseball player Yogi Berra when he said: «In theory, there is no difference between theory and practice, but in practice, there is.» If we are aware of its weaknesses, the Phillips curve can continue to serve as a useful instrument for forecasting inflation in the future.
The author Andreas Vetsch is a hedge fund analyst at LGT. His area of expertise is trading strategies. Before joining LGT in 2012, he studied at the University of St. Gallen, where he received a master’s in banking and finance and a second degree in business journalism. A sports enthusiast, Andreas Vetsch enjoys spending his free time biking, hiking or on the slopes.